
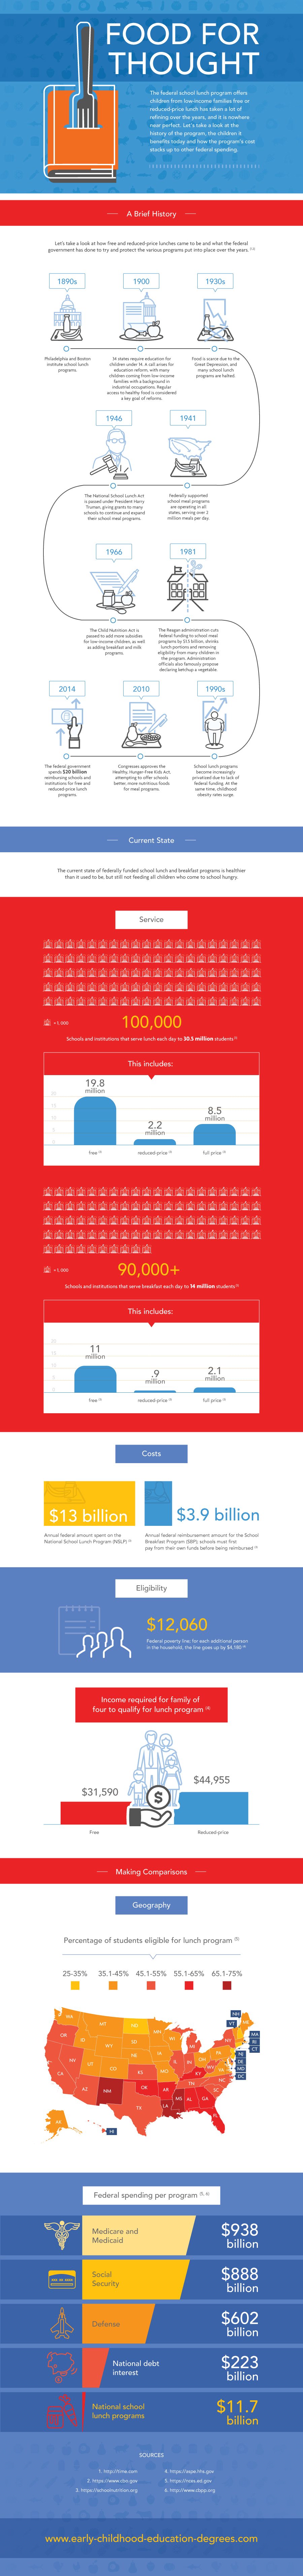
Food for Thought: The National School Lunch Program
The federal school lunch program offers children from low-income families free or reduced-price lunch has taken a lot of refining over the years, and it is nowhere near perfect. Let’s take a look at the history of the program, the children it benefits today and how the program’s cost stacks up to other federal spending.
A Brief History
Let’s take a look at how free and reduced-price lunches came to be and what the federal government has done to try and protect the various programs put into place over the years. (1,2)
1890s
Philadelphia and Boston institute school lunch programs.
1900
34 states require education for children under 14. A call arises for education reform, with many children coming from low-income families with a background in industrial occupations. Regular access to healthy food is considered a key goal of reforms.
1930s
Food is scarce due to the Great Depression, and many school lunch programs are halted.
1941
Federally supported school meal programs are operating in all states, serving over 2 million meals per day.
1946
The National School Lunch Act is passed under President Harry Truman, giving grants to many schools to continue and expand their school meal programs.
1966
The Child Nutrition Act is passed to add more subsidies for low-income children, as well as adding breakfast and milk programs.
1981
The Reagan administration cuts federal funding to school meal programs by $1.5 billion, shrinks lunch portions and removing eligibility from many children in the program. Administration officials also famously propose declaring ketchup a vegetable.
1990s
School lunch programs become increasingly privatized due to lack of federal funding. At the same time, childhood obesity rates surge.
2010
Congresses approves the Healthy, Hunger-Free Kids Act, attempting to offer schools better, more nutritious foods for meal programs.
2014
The federal government spends $20 billion reimbursing schools and institutions for free and reduced-price lunch programs.
Current State
The current state of federally funded school lunch and breakfast programs is healthier than it used to be, but still not feeding all children who come to school hungry.
Service
100,000
Schools and institutions that serve lunch each day to 30.5 million students (3)
This includes:
19.8 million free (3)
2.2 million reduced-price (3)
8.5 million full price (3)
90,000+
Schools and institutions that serve breakfast each day to 14 million students (3)
This includes:
11 million free (3)
900,000 reduced-price (3)
2.1 million full price (3)
Costs
$13 billion
Annual federal amount spent on the National School Lunch Program (NSLP) (3)
$3.9 billion
Annual federal reimbursement amount for the School Breakfast Program (SBP); schools must first pay from their own funds before being reimbursed (3)
Eligibility
$12,060
Federal poverty line; for each additional person in the household, the line goes up by $4,180 (4)
Income required for family of four to qualify for lunch program (4)
Free: $31,590
Reduced-price: $44,955
Making Comparisons
Geography
Percentage of students eligible for lunch program (5)
Alabama: 55.1%
Alaska: 38.4%
Arizona: 45.2%
Arkansas: 60.5%
California: 54.1%
Colorado: 39.9%
Connecticut: 34.5%
Delaware: 48%
D.C.: 73%
Florida: 56%
Georgia: 57.4%
Hawaii: 46.8%
Idaho: 45%
Illinois: 46.7%
Indiana: 46.8%
Iowa: 38.9%
Kansas: 47.7%
Kentucky: 56.6%
Louisiana: 66.2%
Maine: 43%
Maryland: 40.1%
Massachusetts: 34.2%
Michigan: 46.4%
Minnesota: 36.5%
Mississippi: 70.6%
Missouri: 45%
Montana: 41.2%
Nebraska: 42.6%
Nevada: 50.3%
New Hampshire: 25.2%
New Jersey: 32.8%
New Mexico: 67.6%
New York: 48.3%
North Carolina: 50.3%
North Dakota: 31.7%
Ohio: 42.6%
Oklahoma: 60.5%
Oregon: 50.6%
Pennsylvania: 39.4%
Rhode Island: 42.9%
South Carolina: 54.7%
South Dakota: 37.1%
Tennessee: 55%
Texas: 50.3%
Utah: 38.2%
Vermont: 36.8%
Virginia: 36.7%
Washington: 40.1%
West Virginia: 51.5%
Wisconsin: 39.3%
Wyoming: 37.1%
Federal spending per program (5, 6)
Medicare and Medicaid: $938 billion
Social Security: $888 billion
Defense: $602 billion
National debt interest: $223 billion
National school lunch programs: $11.7 billion
Sources:
1. http://time.com
2. https://www.cbo.gov
3. https://schoolnutrition.org
4. https://aspe.hhs.gov
5. https://nces.ed.gov
6. http://www.cbpp.org